01 / 03
1. Define the slowdown
- Record the affected workflow, host, start time, time zone and whether all users are affected.
- Ask the owner about maintenance, traffic changes and recent deployments around that time.
- Choose a comparable healthy interval and preserve the versions and topology.
You should seeA specific symptom and interval keep unrelated historical errors from being mistaken for the cause.
02 / 03
2. Inspect resources
- Run uptime, free -h and df -h on the affected host; check available disk space and memory as well as load.
- Run top in a permitted shell and note sustained CPU and memory consumers; take more than one observation.
- Compare with the baseline and inspect the relevant service status and logs for the incident window.
Observed resource snapshot
Open to enlarge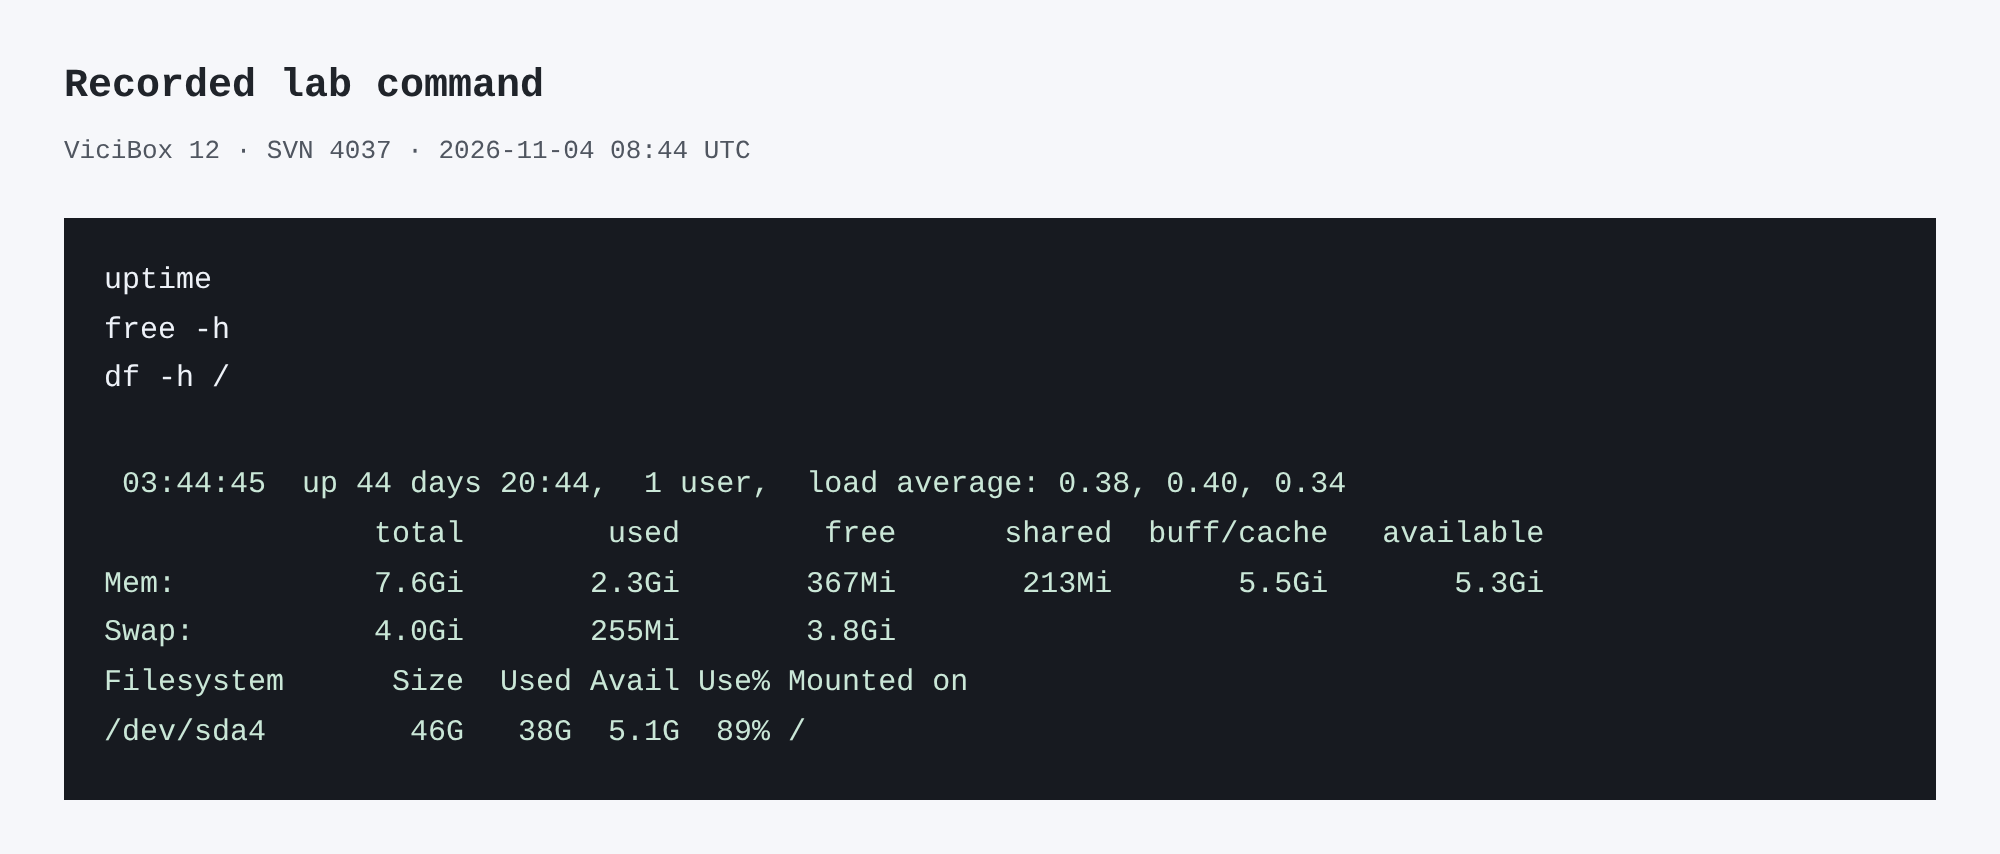
Capture details
This inspection does not establish a completed call or restore.You should seeHigh load or low free memory alone does not establish a root cause; correlate sustained pressure with the affected workflow.
uptimefree -hdf -h /Evidence · Recorded ViciBox 12 lab · SVN 4037 · read-only inspection
Captured demo response · 2026-11-04T08:44:45.138430Z. Any filtering, hidden values or test-only data are identified in the capture label. Select Replay transcript to read the recorded output.
Command output line: uptime
free -h
df -h /
03:44:45 up 44 days 20:44, 1 user, load average: 0.38, 0.40, 0.34
total used free shared buff/cache available
Mem: 7.6Gi 2.3Gi 367Mi 213Mi 5.5Gi 5.3Gi
Swap: 4.0Gi 255Mi 3.8Gi
Filesystem Size Used Avail Use% Mounted on
/dev/sda4 46G 38G 5.1G 89% /
- Before you run it
- Run on the authorized host and compare with the same host under normal load.
- Success looks like
- The lab snapshot showed the root filesystem at 89 percent used. One observation does not establish a performance cause.
- Stop if
- If a command is unavailable, use the host owner’s supported equivalent.
03 / 03
3. Check database activity with the owner
- Ask the database owner to inspect active queries and locks using an appropriately privileged account.
- Compare slow queries and lock waits with the affected interval and the actual table engines.
- Escalate the redacted observations; test a proposed index or configuration change in a representative lab before scheduling it.
You should seeAvoid restarting services, killing queries or applying tuning recipes before identifying their impact and obtaining approval.
Primary references
Sources
- MariaDB SHOW PROCESSLISTMariaDB · accessed November 4, 2026
- systemctl manualsystemd · accessed November 4, 2026